

Analyzes data from tables, builds graphs and helps prepare a report.
Start by asking your data.
Julius AI receives data and helps perform analysis through dialogue. The result can be a calculation, a graph or a draft report. For the answer to make sense, explain what each important column means and what unit you are comparing. If there are daily and monthly amounts in the unloading, divide them before calculating.
The service has other modes of creating materials. For an analytical task, it is more convenient to keep a focus on data and verifiable calculations.
Find the reason for the discrepancy in the table
In the training example, there are lines with orders and returns by weeks. Ask to count the number of orders and the share of returns for each period. Specify whether the canceled lines are included and ask for separate markings. Then manually check the week where the lines are the least. The filter error is easier to see. Then compare the total for all weeks with the number of lines in the source file.
In the graph, check the axes, signatures and the order of the weeks. A peak explanation only makes sense if it relies on available data. If there is no reason in the table, describe the observation and the list of questions for the next check.
Limitations of Cloud Analysis
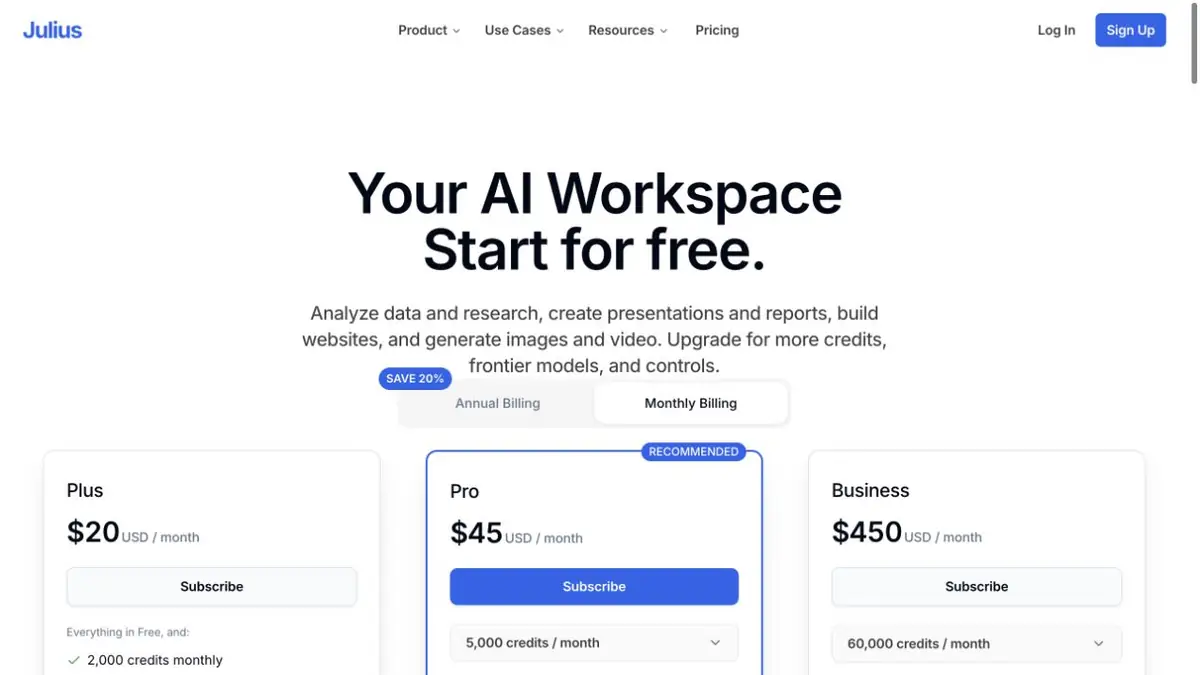
Internet is required for work. You can start free. Paid plans vary in terms of loans, regimes and export opportunities. Before downloading the working file, specify what information can be transferred to the cloud service. For the first check, a depersonalized fragment with a previously known result is enough.
Suitable tasks
- Calculate the share of returns by weeks
- Construct a graph according to the table
- Prepare a verifiable report
Strengths
- Data dialogue and visualization
- One process for calculation and reporting
Limitations
- Filters and totals require reconciliation
- Regimes and exports depend on the plan
Selection and conditions
- Free access
- Yes
- Trial period
- Not confirmed
- No sign-up required
- Not confirmed
- Russian interface
- Not confirmed
- Local installation
- No
- API
- Not confirmed
“Not confirmed” means there is not enough information. The feature may still be available; check the developer’s terms.
- Input formats
- Text, Table, Data
- Result
- Text, Data, Image
Terms
The work is in the cloud. Analysis and export regimes, as well as loans, depend on the plan.From task to first result
Practical example
- Task
- Calculate the share of returns by weeks
- What to prepare
- Anonymized practice campaign data with spend, impressions and leads; metric definitions have been agreed.
Task brief or prompt
Analyst task: connect the table and summarize the campaigns. Compare spend and leads, and flag missing data. Keep past results separate from forecasts and assumptions.
Expected result
A draft analytical report on the selected data, without a guarantee of the result of future advertising.
How to check the result
- Recalculate the selected metric manually.
- Check dates, currency and consistent lead definitions.
An editorial teaching example of a task brief, not the result of hands-on testing of the service. Check that the required mode is available, that you have rights to the source material and that the intended use of the result is permitted.
Check details
Official sources
This description is based on the developer’s material. Features, prices and availability may change; check the primary source before use.