

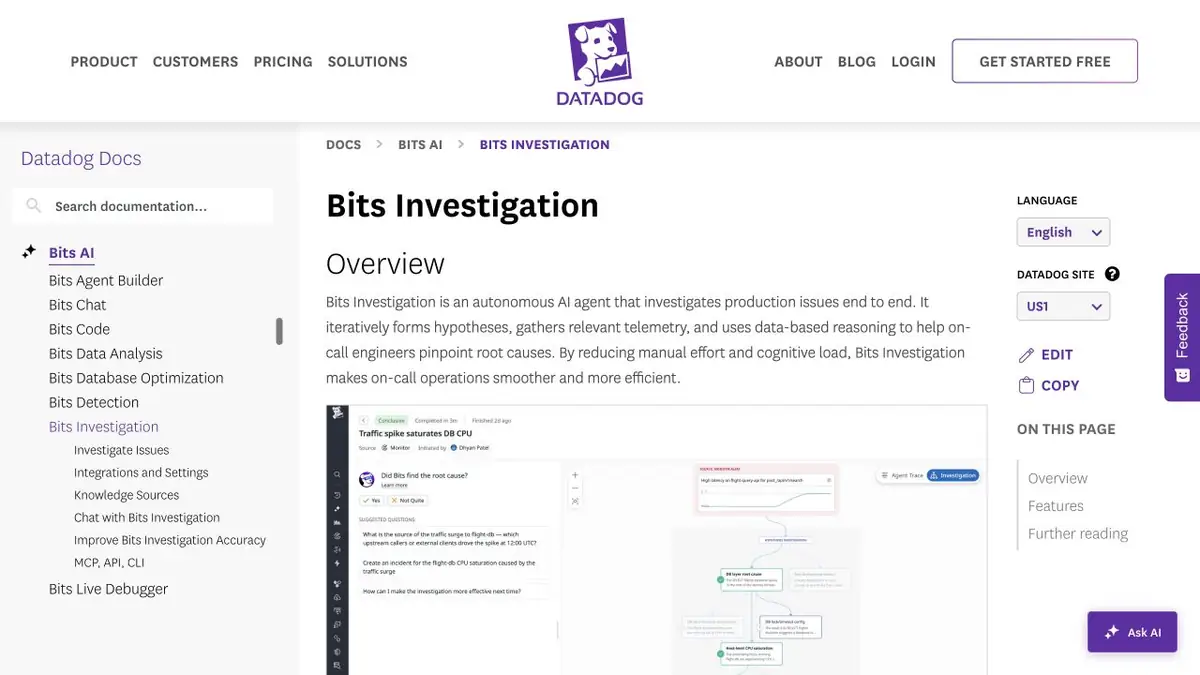
Bits Investigations uses Datadog telemetry to look for related context for an incident and show the basis of hypotheses about its cause.
Metrics grow in several places
During the practice incident, the delay increased after release. At the same time, the database is slower to respond. Both events may be part of the same cause, but the order of the signals still needs to be clarified. Bits Investigations collects relevant data from Datadog. Open the original graphs and traces to see the time interval, environment and services that the hypothesis is based on.
If one source is not connected, this should be noted in the analysis. The absence of a signal in the summary does not mean that it did not exist.
Checking the timeline
In the practice scenario, record when latency increased, mark the release, and select a few normal and slow requests. Check which span takes longer. If the change appears in only one application version, inspect the differences. If it affects both, look at shared dependencies and load. Record which data supports each step, which events only coincide in time, and what else you need to collect.
Next up is the duty officer.
Agree with the owner of the service and the current rules of response. For comparison, save the time window, request terms and a link to the graph before changing. After work, check whether the delay has decreased for the desired group, and not only the average value for all requests. Such a journal helps to understand the situation, even if the first hypothesis turned out to be wrong.
Suitable tasks
- Compare API delay with release changes
- Check if different services are affected by one cause
Strengths
- Picks up context from connected telemetry
- Shows the course of the search and the grounds for the investigation
Limitations
- Some hypotheses may lack evidence when traces are incomplete
- A timing correlation does not establish the cause
Selection and conditions
- Free access
- Not confirmed
- Trial period
- Not confirmed
- No sign-up required
- Not confirmed
- Russian interface
- Not confirmed
- Local installation
- Not confirmed
- API
- Not confirmed
“Not confirmed” means there is not enough information. The feature may still be available; check the developer’s terms.
- Input formats
- Data, Text
- Result
- Text, Data
Terms
Datadog sets separate terms for observability and AI features. Check how your organization is billed for investigations and telemetry retention. Some hypotheses may lack evidence when traces are incomplete.From task to first result
Practical example
- Task
- Compare API delay with release changes
- What to prepare
- Synthetic delay surge, release events and tracks of the two services.
Task brief or prompt
Get a timeline. Specify which signal confirms the hypothesis and what cannot be established yet.
Expected result
Time line with verifiable links to metrics and routes.
How to check the result
- Compare the affected requests with the usual ones.
- Separate the time match from the confirmed cause.
An editorial teaching example of a task brief, not the result of hands-on testing of the service. Check that the required mode is available, that you have rights to the source material and that the intended use of the result is permitted.
Check details
Official sources
- Bits Investigations Page
- Working procedure Bits Investigation
- Tariffs Datadog
- Datadog report on specialized Scout model for Bits
This description is based on the developer’s material. Features, prices and availability may change; check the primary source before use.